
Infected emails, malicious links, backdoor threats and even targeted advertisements can all be malware carriers. Malware is one of the biggest security threats to any type of technological device, and each type of malware uses unique tactics for successful invasions. These cyberattacks can cause financial and personal harm, including data breaches and system damage.
Even if you’ve downloaded a VPN for internet browsing, our in-depth guide discusses the 14 types of malware you should be aware of, what malware is and how to prevent it from overwhelming your systems.
| Type of Malware | What It Does |
|---|---|
| Ransomware | Encrypts files and demands payment for their release |
| Fileless malware | Operates in memory to avoid detection and persist on the system |
| Adware | Displays unwanted advertisements, often leading to other malware |
| Trojans | Disguises as legitimate software to gain access and control |
| Spyware | Secretly monitors and collects user information and activities |
| Viruses | Attaches to files/programs and spreads to other systems, causing damage |
| Worms | Self-replicates and spreads across networks, often causing disruptions | Rootkits | Hides deep in the system to gain and maintain privileged access | Botnets | Steals data, sends spam, and allows the attacker to access the device and its connection | Mobile malware | Targets mobile devices to steal data, spy or damage the device | Wiper malware | Destroys data on infected systems, often irreversibly | Keyloggers | Records keystrokes to capture sensitive information like passwords | Cryptojacking | Uses system resources to mine cryptocurrency without the user’s consent | Hybrid malware | Combines features of multiple malware types for more complex attacks |
1. Ransomware
Ransomware is a virus that encrypts all the files on an infected device, and 22% of cybersecurity professionals say it’s a top threat for organizations.. Once encrypted, the device becomes unusable because none of the data stored on it can be accessed.
Ransomware attacks request a ransom in exchange for a decryption key that will unlock a device’s files. As there is no guarantee that the hacker will release the decryption key, paying a ransom is not an ideal solution. To prevent ransomware attacks, keep a current backup of all your files on hand so you can restore your device yourself.
Ransomware example:
Rogue security software is a type of ransomware that poses as a virus or security breach. Users are required to pay the rogue software to remove the fake issue.
2. Fileless Malware
Fileless malware is a type of malware that uses macros and system tools to invade a system rather than executable files. This type of malware will edit already installed files, which many systems recognize as legitimate. Fileless malware is difficult to protect against because no malicious program has been installed.
To protect your devices against fileless malware, limit login credentials and knowledge. Multifactor authentication is an additional protective element that can keep hackers from infiltrating a system and running stealth operations unknowingly.
Fileless malware example:
PowerShell-based malware exploits Windows PowerShell to execute malicious commands directly in memory, evading traditional antivirus detection by not writing files to the disk. It can download and run additional malicious code, manipulate files and gather sensitive information with minimal traces.
3. Adware
Adware tracks internet surfing habits and suggests ads and spam to the user. While this type of malware doesn’t install anything onto your device, it can hamper performance, which can make your items more vulnerable to other types of attacks.
Adware that plants malicious ads onto a user’s device is known as malvertising. These types of malware are intended to plant dangerous code onto a device when a link, pop-up or advertisement is clicked on. Updated operating systems and spam filters can help protect devices against adware.
Adware example:
Browser hijackers can modify a user’s web browser settings without permission. They redirect searches, change the homepage and flood the device with unwanted ads, often leading to malicious sites. This intrusive behavior not only disrupts browsing but can also compromise security by exposing devices to further malware infections.
4. Trojans
Trojans, named after the Greek legend of the Trojan Horse, are a type of malware that sneaks onto a victim’s device. Once installed, the trojan waits to be activated before attacking.
This form of malware may delete and damage data or simply create a backdoor, allowing hackers to access and use the infected device when they choose. Trojans are a popular way to connect devices to botnets — another type of malware — or launch distributed denial-of-service attacks (DDoS).
Trojan example:
Remote access trojans (RATs) allow attackers to gain unauthorized remote control over an infected system. They can monitor user activity, steal sensitive information, install additional malware and manipulate files, often operating covertly to avoid detection
5. Spyware
Modern systems are designed to protect passwords and sensitive data using encryption. Spyware helps attackers get around and break down encrypted data.
Once installed, spyware collects and logs usage data, including the websites you visit, credentials you use and keyboard buttons you push. This information is periodically updated, reported and reassembled, allowing the hacker to read your passwords and use them to break into your online accounts.
Spyware example:
RAM scrapers steal and store data from devices before it can be encrypted. For example, point-of-sale devices temporarily store credit card information, which RAM scrapers can monitor and steal.
6. Viruses
Viruses may be one of the most commonly known types of malware. These invaders can affect device speed and performance, steal sensitive data, damage and destroy files and create backdoor opportunities for larger-scale attacks.
Viruses depend on host applications to run and survive. Removing a virus requires users to also remove its host. Viruses can infect additional systems, so downloading antivirus software is the best way to prevent this type of malware from affecting your devices.
Virus example:
Logic bombs will only attack a system once they have been triggered. These triggers can be a certain date and time, a specific number of logins or the startup of a certain application. Viruses use them to deliver malicious code at specified times, and they can go completely undetected until triggered.
7. Worms
A worm is a type of virus designed to copy itself and spread to devices on a shared network. This means that an infection on your home PC can quickly spread to your laptop, phone and any other systems connected to the same network.
While the infection may not necessarily damage or delete files, it can cause your devices and network to slow down or become unresponsive. This type of malware may also use your digital address book to email itself to other people you know, potentially infecting their devices, too.
Worm example:
Conficker is a type of worm that exploits vulnerabilities in Windows to rapidly spread across networks, creating botnets for malicious activities. It disables security features and updates, making infected systems even more susceptible to further attacks.
8. Rootkits
Injected into applications and firmware, rootkits are a type of malware that give hackers complete remote control of an infected device. Because this software gives attackers administrative privileges, they can conceal other malware attacks and affect different types of files.
Rootkits were not initially created as malware, but their remote capabilities have made them a favorite attack option of hackers. Multifactor authentication and limited administrative credentials can help protect against this malware type.
Rootkit example:
Kernel rootkits are a type of rootkit that manipulate the operating system’s kernel to gain unauthorized access and control over a computer system. By modifying critical parts of the kernel, they can hide malicious processes and files, making them invisible to traditional security measures.
9. Botnets
A botnet is a software made up of bots that can follow automated, remote commands. While many botnets and bots are used for important, legitimate tasks — like search engine indexing — they can also be used as a type of malware that attacks central servers.
If botnets are used for flood attacks like DDoS attacks, they can incapacitate systems, servers and devices. Additionally, botnets can include large numbers of technological devices, so they can be difficult to shut down completely.
Botnet example:
Zeus, also known as Zbot, is a notorious botnet that primarily targets financial institutions. It infects computers through phishing emails or drive-by downloads, allowing cybercriminals to remotely control infected machines to steal banking credentials, credit card information and other sensitive data.
10. Mobile Malware
Unlike traditional types of malware, mobile malware is designed to target a specific type of device: mobile devices. Mobile malware for smartphones, tablets and other mobile devices can spy on user actions, steal credentials, overtake administrative privileges and more.
Mobile malware is frequently spread through SMS phishing (smishing) and text message scams. Trojans, ransomware and adware targeting mobile devices can also be considered mobile malware. Additionally, jailbroken phones are at a higher risk of a mobile malware invasion.
Mobile malware example:
SMS trojans are a type of mobile malware that disguise themselves as legitimate applications but, once installed, silently send premium-rate text messages without the user’s consent. This can result in financial losses and potentially compromise personal information stored on the device.
11. Wiper Malware
Wiper malware is a type of malware with the sole purpose of erasing data and making it unrecoverable. Many attackers use wiper malware to target both private and public businesses.
Wiper malware is also used after other malware attacks. Because it can erase and destroy data, attackers will use wiper malware to remove traces of invasions, which can make organizational recovery difficult or even impossible.
Wiper malware example:
Ryuk is a wiper malware type notorious for its targeted attacks on large organizations. It encrypts files and demands exorbitant ransom payments, but even after payment, it often leaves systems corrupted or data irrecoverably wiped, causing significant disruption and financial loss.
12. Keyloggers
Keyloggers are malicious programs designed to record keystrokes on a computer or device, enabling attackers to capture sensitive information such as passwords, credit card numbers and other confidential data. For example, a keylogger installed on a victim’s computer can silently record every keystroke they make, allowing the attacker to obtain login credentials for online banking accounts.
Keylogger example:
Hardware keyloggers are physical devices inserted between a computer’s keyboard and USB port, capturing keystrokes directly. They are difficult to detect because they operate externally to the computer’s operating system and antivirus software, making them a stealthy choice for attackers aiming to gather sensitive information.
13. Cryptojacking
Cryptojacking is when malicious actors secretly use your computer’s processing power to mine cryptocurrencies like Bitcoin or Ethereum without your knowledge or permission. This can slow down your device, increase energy consumption and potentially cause hardware damage. It often happens through infected websites, malicious ads or compromised software.
Cryptojacking example:
Remote access cryptojacking involves malware infecting computers or servers, granting attackers remote access to control the systems for cryptocurrency mining without the user’s knowledge. It operates silently in the background, utilizing the victim’s resources for profit.
14. Hybrid Malware
Hybrid malware combines features of different types of malicious software to create more sophisticated attacks. For example, it could blend the characteristics of ransomware and botnets, encrypting files while also enslaving devices into a network for further malicious activities.
Hybrid malware example:
Ransomworm is a combination of ransomware and worms. A ransomworm spreads rapidly across networks, encrypting files on infected systems and demanding ransom for decryption.
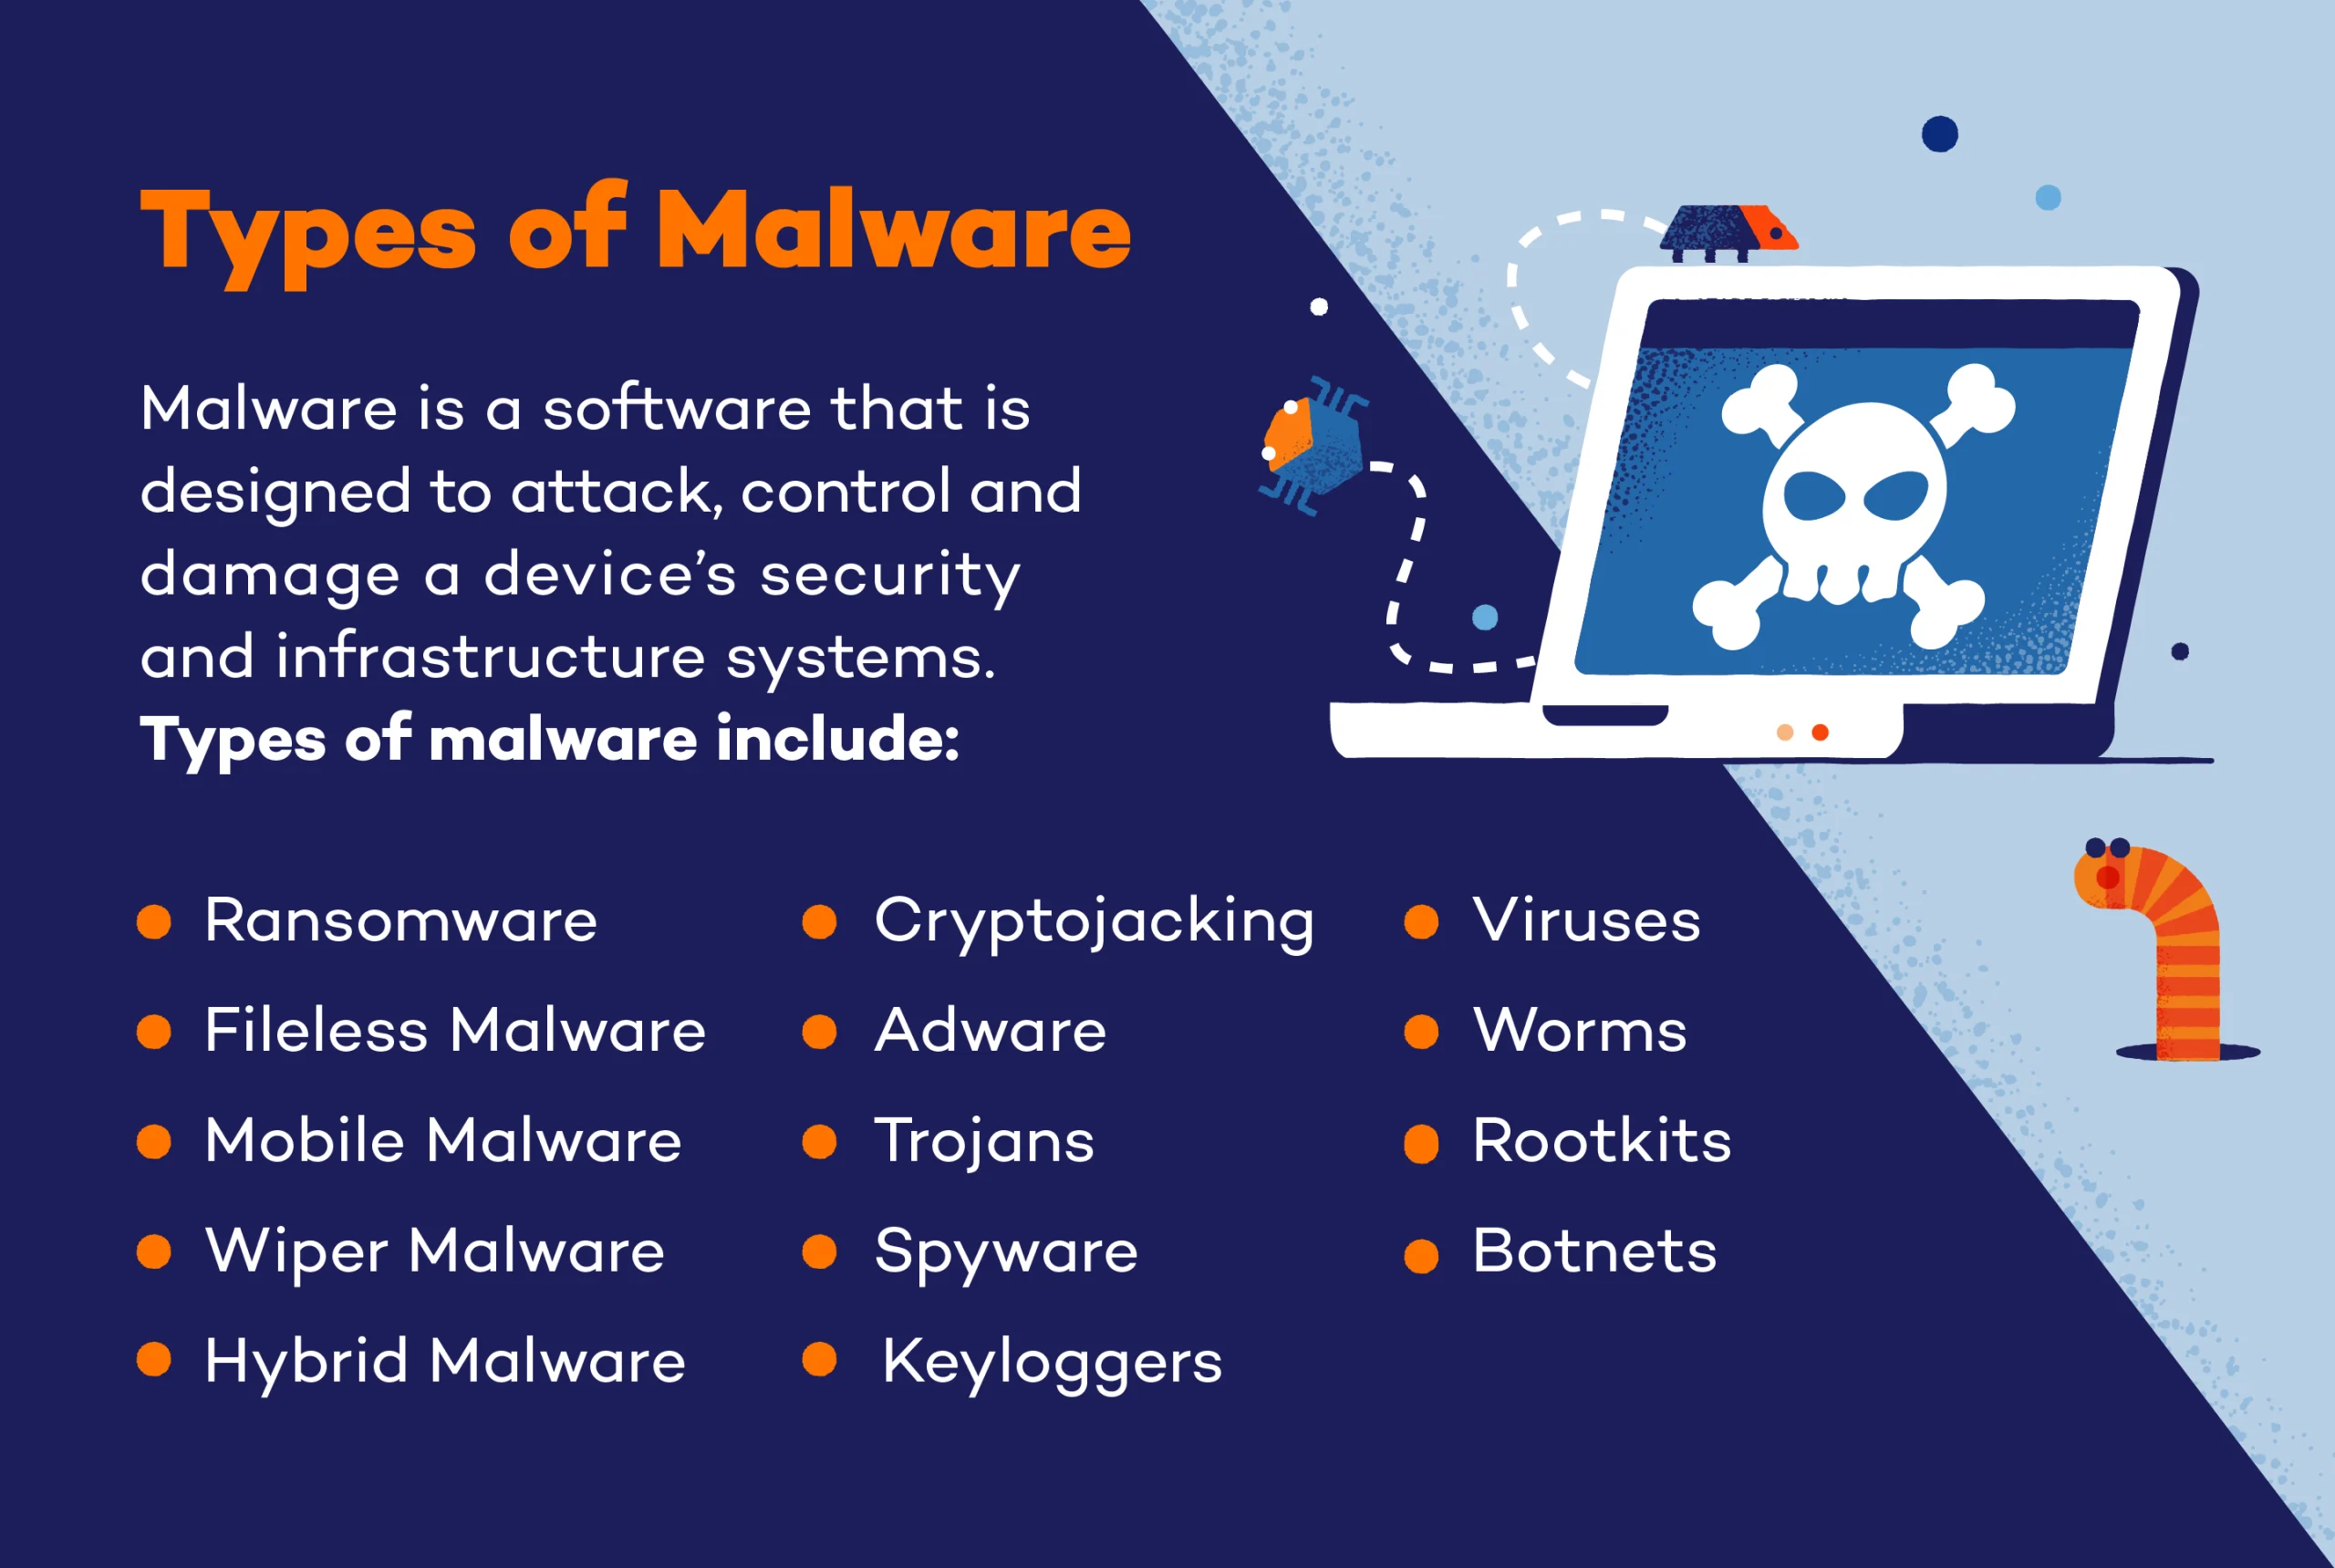
What Is Malware?
Malware is a software that is designed to attack, control and damage a device’s security and infrastructure systems. Once launched, malware will attach itself to a selected program or device. In order for malware to infect a device, it must be sourced. Some of the most common malware sources include:
- Phishing: Phishing consists of an attacker posing as a trustworthy individual or site to convince a target to reveal personal or valuable information.
- Social engineering: Social engineering gains a target’s trust to obtain information. This tactic harnesses human error and interactions in order to receive information.
- Pop-ups: Pop-ups can include malicious links or lead to fake landing pages where malware is waiting to infiltrate a system.
- Drive-by downloads: Visiting fake websites that host malware exploit kits can compromise systems.
- Shared networks: Shared networks with a malware-infected device may spread malware to other network devices.
How to Prevent Malware
Preventing malware from infecting your devices can be difficult. If they manage to invade your systems, they can move from device to device, slow down entire servers and steal, delete or encrypt sensitive data. To prevent this from happening, follow these six tips:
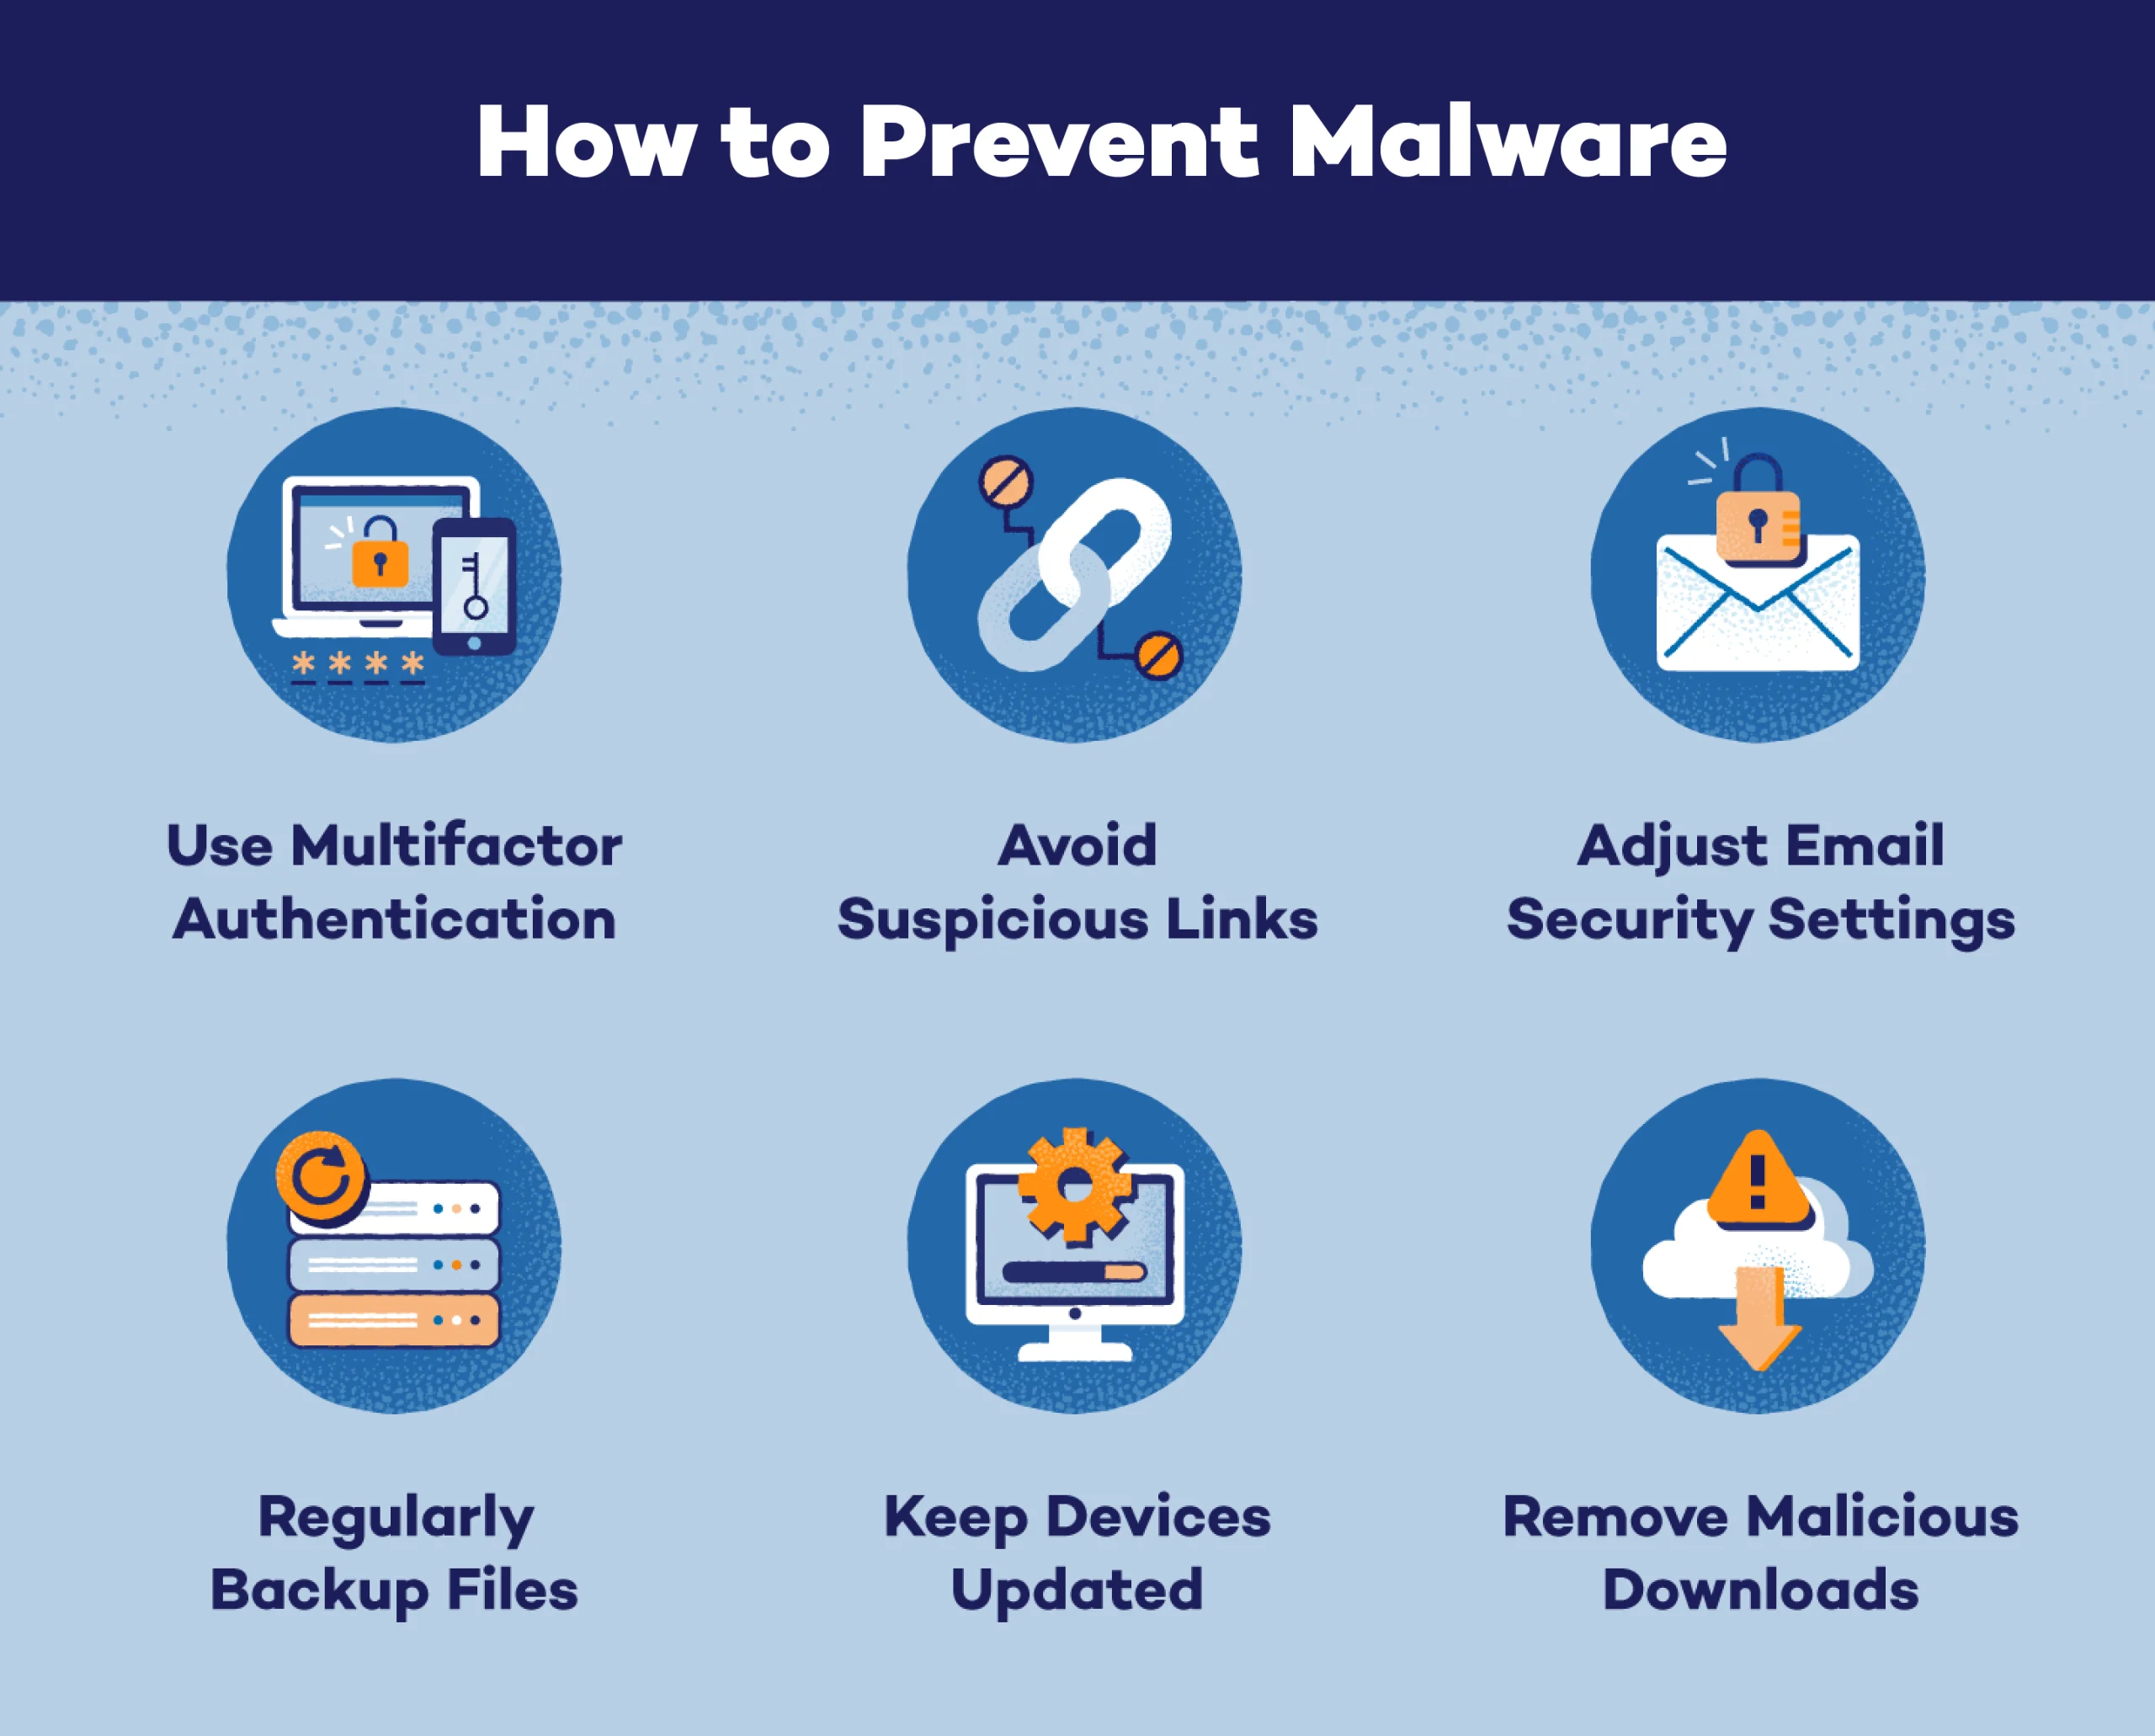
- Use multifactor authentication. Multifactor authentication adds additional security to accounts, including banking, social and shopping accounts. This can help protect your credentials and passwords.
- Don’t click suspicious links. Many attackers embed malware into email links or pop-ups. Avoid clicking anything that doesn’t come from a trusted source.
- Adjust email security settings. Email is one of the most common delivery methods for malware. Keeping spam filters high and email security on can reduce the number of infected messages landing in your inbox.
- Regularly back up files. If your device is invaded by malware — like ransomware or a virus — you can restore your device’s most recent files. This can help you remove malware without paying ransom or infecting other devices.
- Keep devices updated. Device updates frequently include security updates to patch holes and potential backdoor entries. Enabling automatic updates or updating a device as soon as new software is available can help keep you protected.
- Remove malicious apps or downloads. If your device becomes infected, remove the malware, app or download as soon as possible. Each device has a different removal process, so be sure to research the safest way to remove malware before diving in.
Most importantly, install antivirus software on all of your devices. Because all types of malware can cause varying levels of damage — from simple annoyances to total data loss — they should never go ignored, tolerated or concealed.
In addition to antivirus software, our Panda Dome security toolkit can help prevent malware installation, and detect, block and clean viruses that may already be infecting your devices.
Panda Security specializes in the development of endpoint security products and is part of the WatchGuard portfolio of IT security solutions. Initially focused on the development of antivirus software, the company has since expanded its line of business to advanced cyber-security services with technology for preventing cyber-crime.
You May also Like


Panda Free Antivitus

FREE TECHNICAL SUPPORT

3 comments
I don’t want my files to be corrupted by Ransomware so please help
alleen wordt door panda anti virus openoffice als een trojan gezien, is dit een foutieve instelling bij panda of nog niet herstelt.
your panda anti virus sees the openoffice program as a trojan, or have you a correction for this in progression.