


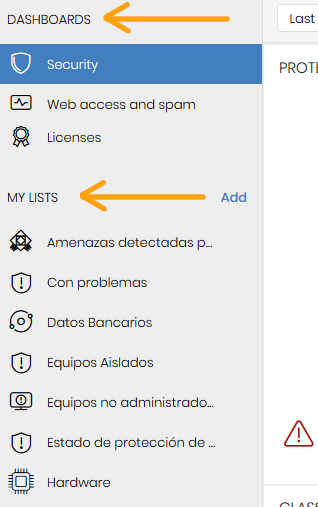
The products based on Aether Platform provide a number of resources that allow administrators to assess the security status of their corporate network at a glance.
The information is collected at two levels: a first level that presents the data graphically in panels or widgets - Dashboards, and a second, more detailed level, where the data is presented in tables - My lists.
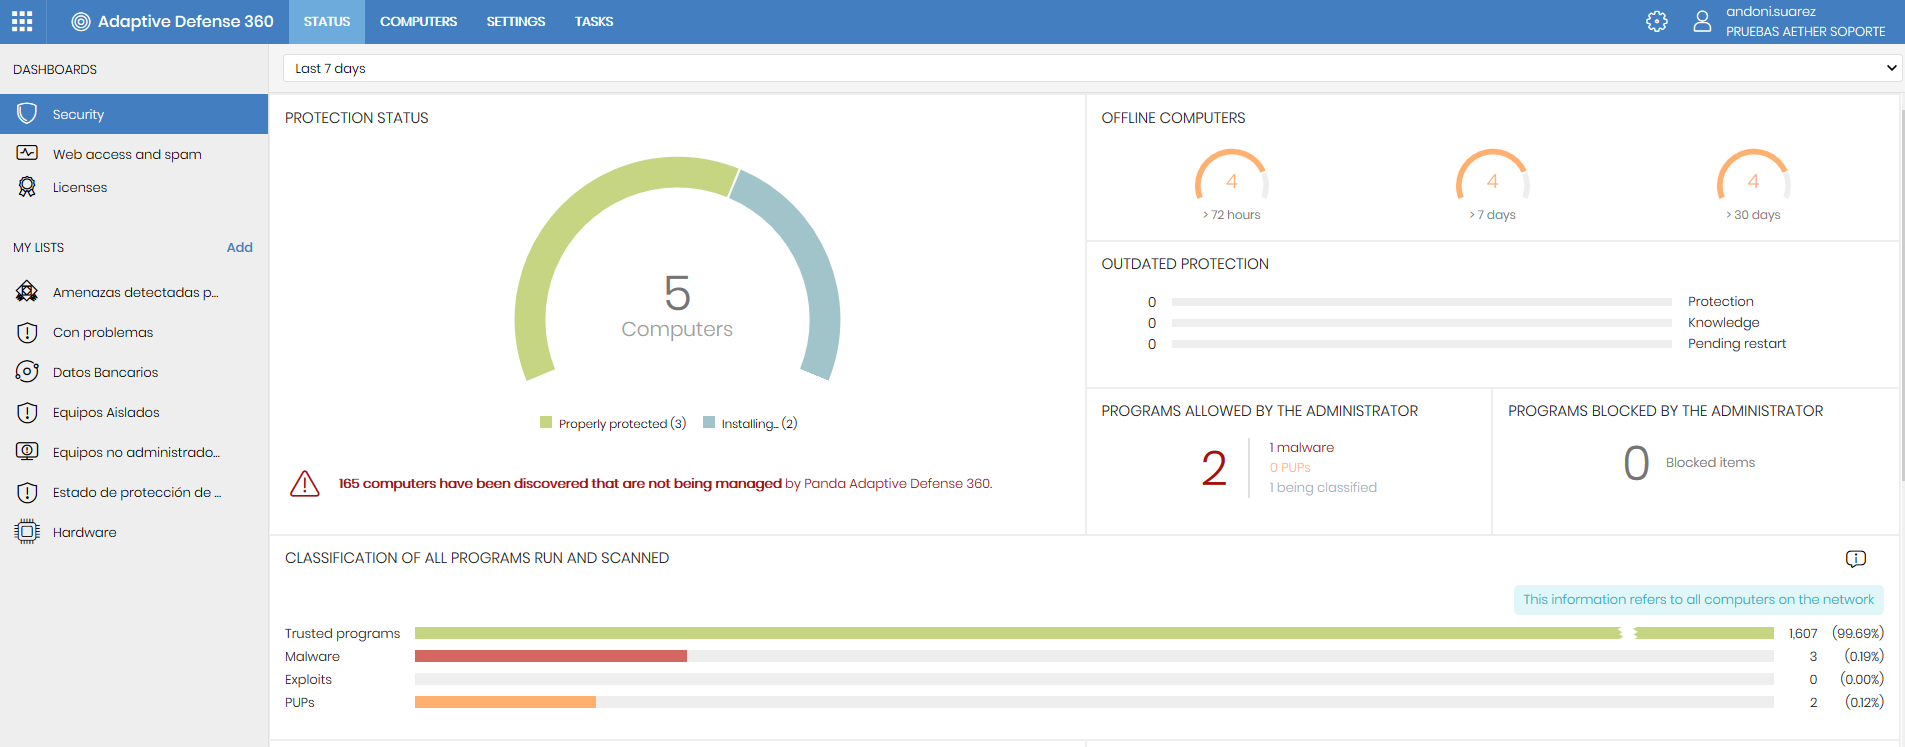
Depending on the product, the dashboard will display different information adjusted to the time period established by the administrator (Last 24 h, Last 7 days, Last month, Last year).
Click on the plus sign to expand the options.
This section is divided into three options: Security, Web access and spam and Licenses.
- Unprotected computers
Includes those computers on which for one reason or another, Adaptive Defense 360 is not operating properly. The status is representedwith a circle with differentcolors and associated counters.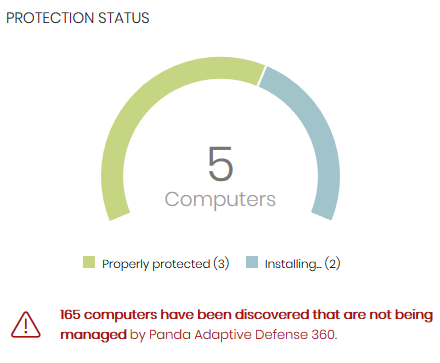
- Offline computers
Displays the computers that have not connected to the Panda Security cloud for a certain amount of time. Such computers are susceptible to security problems and require special attention from the administrator.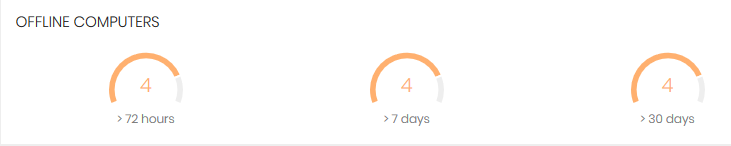
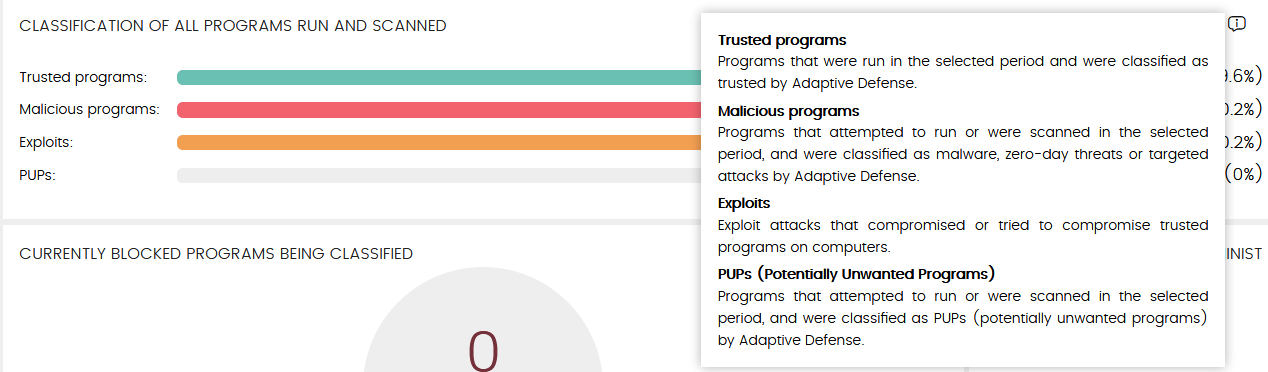
- Classification of all programs run and scanned
- Currently blocked items being classified
Includes those unknown processes detected on the customer's network and that need to be investigated in the laboratories of Panda Security in order to be classified asgoodware or malware. During this process, items may be blocked depending on the protection mode (Lock, Hardening or Audit). - Threats allowed by the administrator
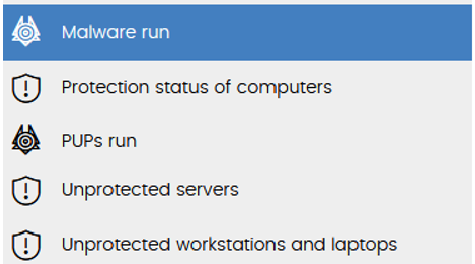
- Malware activity
- PUP activity
- Threats detected by the antivirus
- Content filtered for Exchange servers
Shows the users' Internet activity. It includes information from the following dashboard widgets: Web access, Top 10 most accessed categories, Top 10 most accessed categories by computer, Top 10 most blocked categories, Top 10 most blocked categories by computer and Spam detected on Exchange servers.
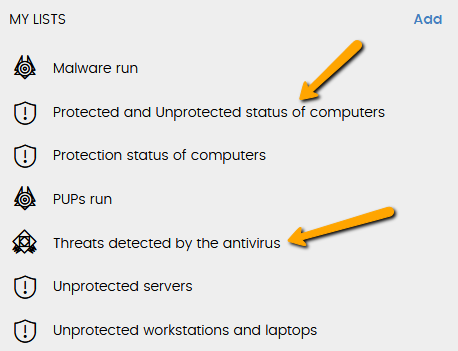
The lists are data tables with information presented in panels. This includes highly detailed information and has search tools to locate the information you need. It is a very valuable tool which complements the information shown
However, you can create custom lists to suit your needs.
Example: the dashboard by default presents the graph of unprotected computers. You can add a list showing the tables of protected computers plus unprotected computers and for instance, another list to show all the threats detected by the antivirus. It is very easy, just click Add, configure the type of list you want and click Save. And you will find access to this list on the