
Windows 10 and 11 have built-in protection through Windows Security, but additional antivirus software offers extra security. Third-party solutions, like Panda Security, provide advanced features such as real-time protection, web security and multi-layered threat detection.
If you’re wondering whether Windows 10 or Windows 11 need antivirus to stay secure from cyber threats, the short answer is: It depends. Both operating systems come with Windows Security, an integrated antivirus solution designed to provide baseline protection.
While this might seem sufficient, Windows Security has historically struggled in certain areas compared to third-party solutions. It lacks advanced features like password managers and built-in VPNs, which many home users now consider essential.
It’s also worth noting that support for Windows 10 will officially end in October 2025, making the question of additional antivirus protection even more critical as security updates cease. In this post, we’ll cover Windows Security, its features and how you can better protect your Windows device.
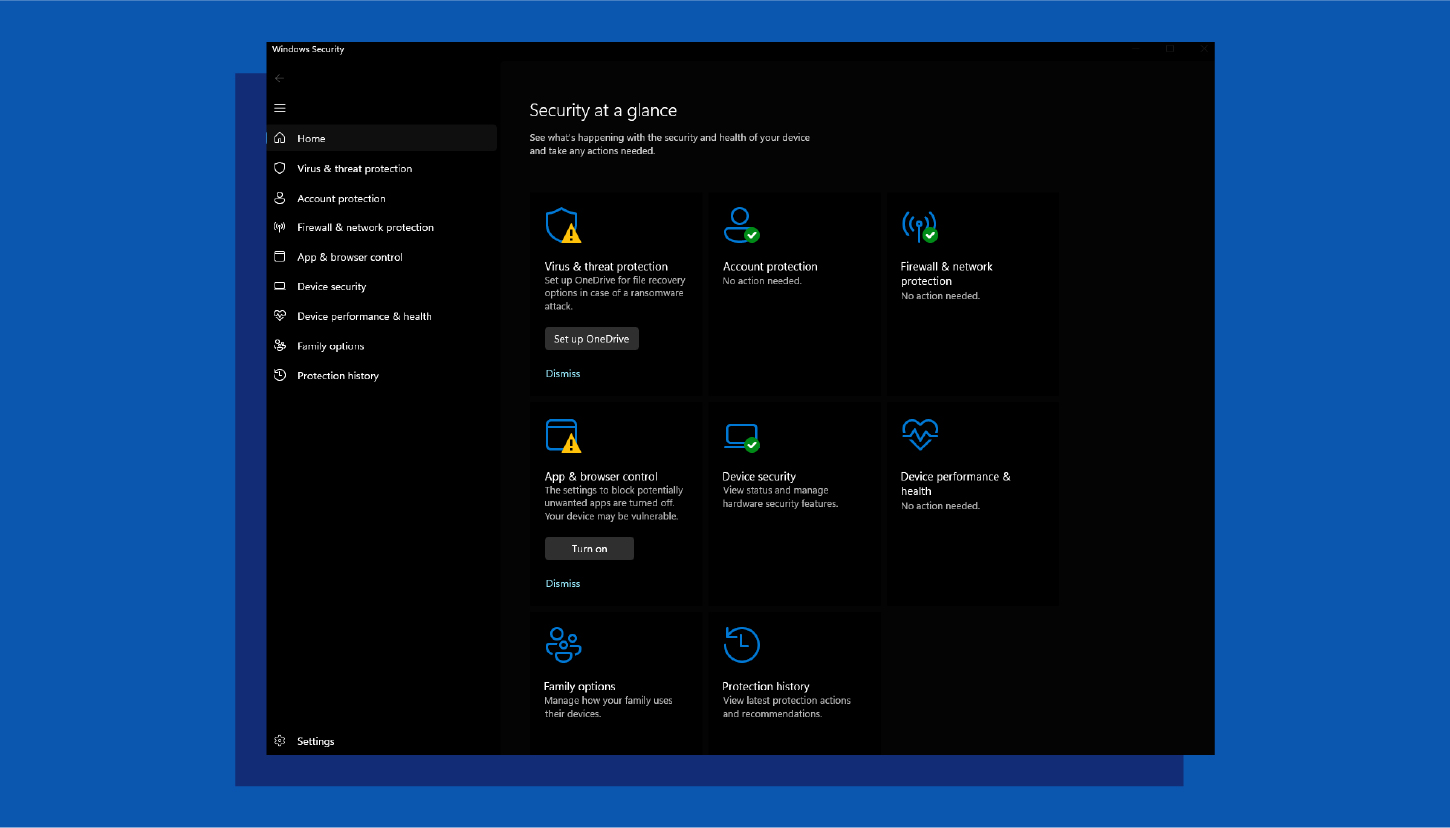
Windows Security— previously known as Windows Defender— is an app built into Windows 10 and 11 to keep your PC secure. It includes a built-in antivirus software called Microsoft Defender Antivirus to protect against malware, viruses and other security threats. It automatically scans files and programs as you use them and provides regular system scans to detect and remove any threats. Windows Security also includes features like cloud-delivered protection and tamper protection to enhance security.
Key features of Windows Security:
- Real-time protection: Constantly monitors your system for malware and other threats, blocking them before they can infect your computer. This includes scanning files and programs as you open or download them.
- Cloud-delivered protection: Leverages Microsoft’s cloud infrastructure to quickly identify and respond to new and emerging threats. This means your definitions are always up-to-date and you have access to the latest protection.
- Automatic scans: Regularly scans your entire system for potential threats, even when you’re not actively using it. You can also schedule scans for specific times or trigger them manually.
- Tamper protection: Prevents malware from disabling or interfering with Windows Defender’s security features, ensuring that your system remains protected.
Windows Security Breakdown
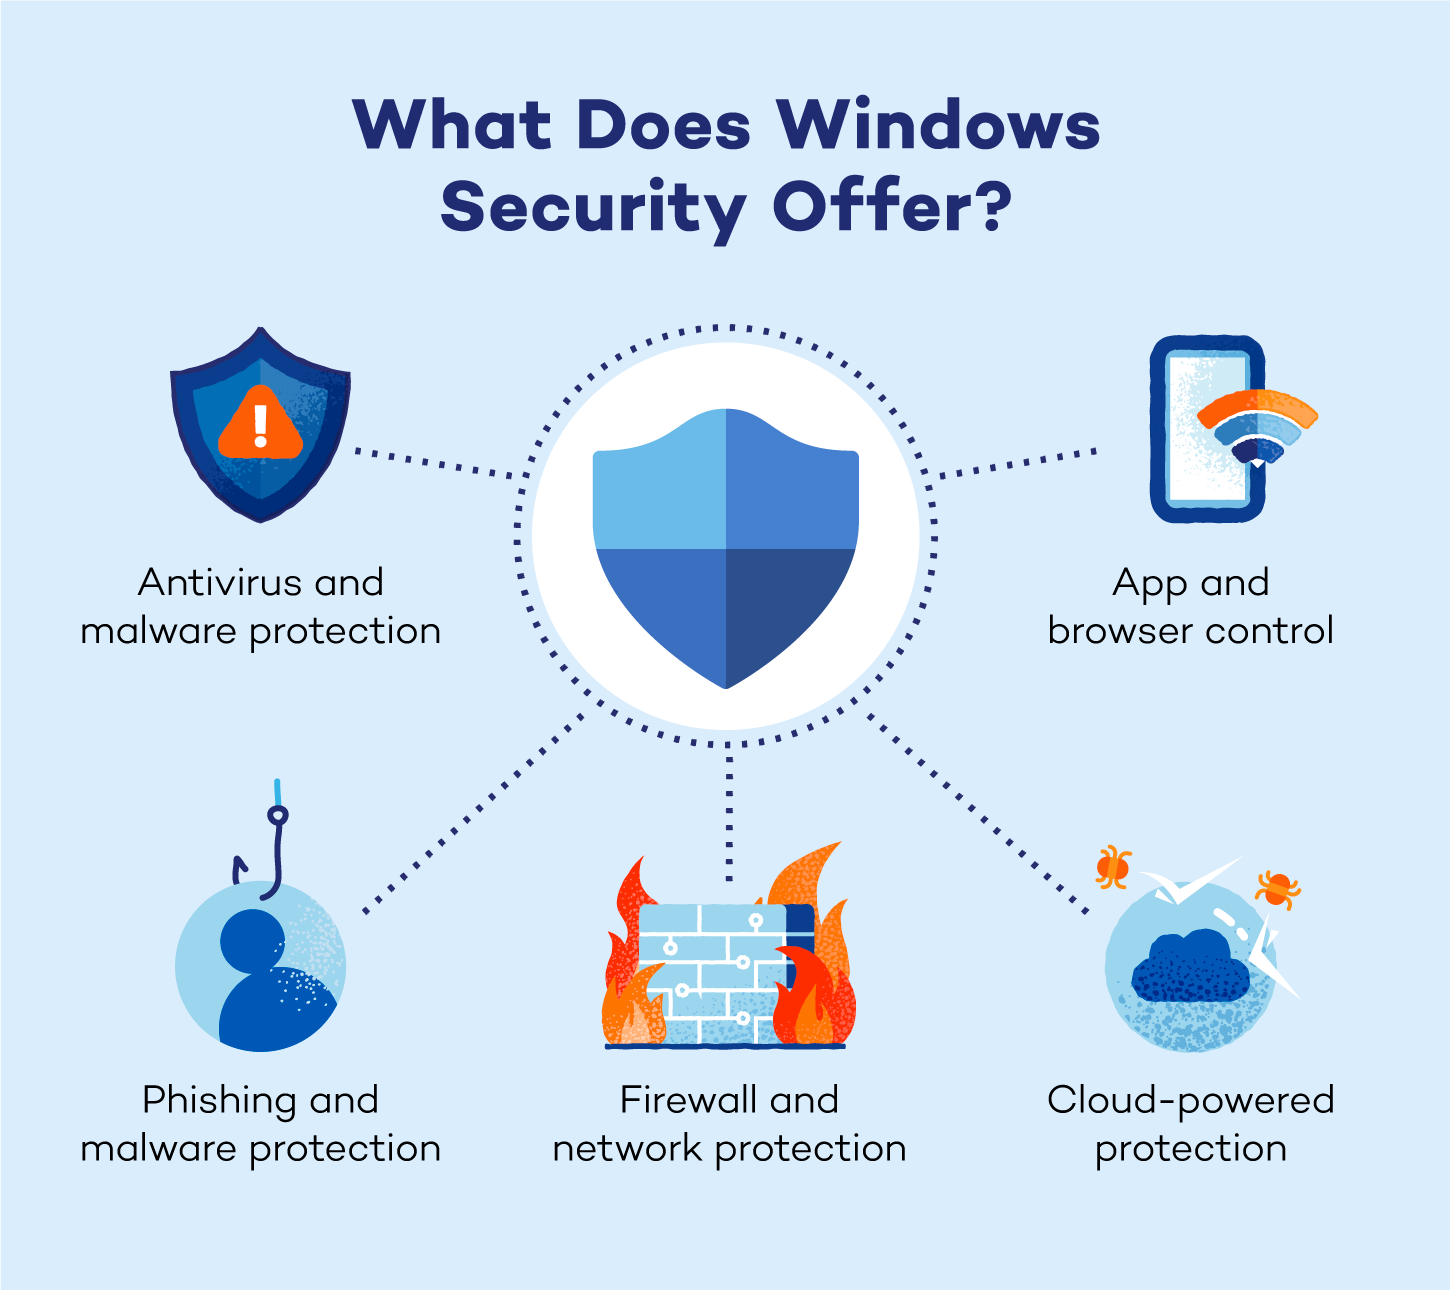
Antivirus and Malware Protection
Windows Defender provides robust protection against a variety of threats, including viruses, trojans, worms, ransomware and spyware. Leveraging a combination of behavioral analysis and signature-based detection, it identifies malicious activities in real time. Its ransomware protection includes controlled folder access, which safeguards critical files from unauthorized modifications.
While Windows Defender excels in providing basic protection, some advanced threats might require additional security measures, especially for users handling highly sensitive data.
Firewall and Network Protection
Windows Defender includes a built-in firewall that monitors and controls network traffic to block unauthorized access that could result in a data breach. This feature helps protect against potential intrusions from hackers or malicious software attempting to exploit vulnerabilities in your system. Users can also customize firewall rules for specific applications or network scenarios.
Additionally, the firewall offers network diagnostics tools to help troubleshoot connectivity issues, making it a valuable resource for maintaining secure and reliable network connections.
Phishing and Malware Protection
Windows Security works in tandem with Microsoft Edge to block phishing attempts and harmful websites. The SmartScreen filter flags suspicious sites, downloads or email attachments, preventing users from accidentally sharing personal or financial information with cybercriminals.
This feature is especially critical for users who frequently shop online or engage in financial transactions, ensuring safer browsing experiences.
App and Browser Control
Windows Security provides oversight on how apps and web content interact with your device. It includes Exploit Guard, which safeguards against vulnerabilities often targeted by malicious actors. Windows Security also offers customization options, allowing users to tweak settings for greater control over app permissions and browsing behavior.
This layer of protection minimizes risks associated with untrusted software and websites, bolstering overall device security.
Cloud-Powered Protection
Windows Security utilizes cloud-based threat intelligence to deliver faster, more effective detection and response capabilities. By analyzing global threat data in real time, the cloud infrastructure helps identify emerging threats and provides instant updates to your device.
Cloud-powered protection ensures Windows Security is always a step ahead, offering improved threat detection accuracy and reduced risk of zero-day attacks.
Problems With Windows Security
Windows Security is a built-in security solution for Windows, but users often encounter performance issues and functionality problems. Here are some of the most common issues reported by users and potential solutions to address them.
System Performance Impact
Users have reported that Windows Security can slow down system performance, particularly during full system scans. This can manifest as longer scan times and increased CPU usage, leading to reduced responsiveness during other tasks.
Inability to Open Windows Security
Some users experience difficulties in launching Windows Security, which can be attributed to corrupted or outdated software, conflicts with other security programs or system file corruption.
Malware Detection and Removal Issues
There are instances where Windows Security fails to detect or remove certain malware effectively. This can be due to outdated definitions, disabled security features or sophisticated malware that evades detection.
Conflicts with Third-party Antivirus Software
Installing third-party antivirus programs can lead to conflicts with Windows Security, resulting in errors or the inability to use one or both security solutions effectively. These conflicts may cause system instability or reduced protection.
Crashes During Scans
There have been reports of Windows Security crashing during full system scans, sometimes due to specific file naming issues (e.g., files with multiple periods in their names) or recent updates causing instability. Such crashes can leave the system vulnerable if scans are not completed successfully.
How to Better Protect Your Windows 10 or Windows 11 System
While Windows Security provides a solid foundation for basic security, pairing it with advanced antivirus software like Panda Dome can offer comprehensive protection against today’s sophisticated cyberthreats.
Advanced antivirus solutions enhance your defense by incorporating features like real-time malware detection, firewall management and ransomware prevention.
Some users report that running a third-party antivirus software disables Window Security’s real-time protection. You can still reap the benefits of both tools by running them asynchronously.
Benefits of pairing Windows Security with a premium antivirus solution like Panda Dome include:
- Advanced threat detection using machine learning and behavioral analysis
- Real-time protection against emerging malware and phishing attacks
- Ransomware protection to secure your files and data
- VPN services for safe browsing on public networks
- Privacy tools to safeguard personal information from unauthorized access
Strengthen your overall security by adopting these best practices:
- Use strong passwords: Create unique, complex passwords for every account to make it harder for attackers to guess.
- Keep your operating system up-to-date: Regular updates fix vulnerabilities and ensure your system is protected against the latest threats.
- Regularly update all your software: Outdated software can have security loopholes, so enable auto-updates wherever possible.
- Enable two-factor authentication (2FA): Add an extra layer of protection to your accounts, making unauthorized access more challenging.
- Be wary of suspicious links: Avoid clicking on links in emails or messages from unknown senders, as they may lead to phishing sites or malware downloads.
- Avoid sketchy websites: Stick to reputable sites and be cautious when downloading files from unknown sources.
- Beware of phishing attempts: Learn to recognize fraudulent emails and websites that attempt to steal your login credentials or sensitive information.
- Use caution when accessing public Wi-Fi: Avoid entering sensitive information on public networks without using a VPN for added security.
- Consider a premium antivirus solution: Advanced tools like Panda Dome complement Windows Security delivering layered security to keep you protected.
Cover All Your Security Bases With Panda Security
Using Panda Dome ensures advanced threat detection, ransomware protection and safe browsing — all vital for staying ahead of today’s sophisticated cyberattacks. Alongside smart security practices like using strong passwords and enabling two-factor authentication, Panda Security provides a robust, all-encompassing solution for safeguarding your devices and personal information.
Don’t leave your security to chance — fortify your defenses with Panda Security’s trusted antivirus software.
FAQ
Is Antivirus Really Necessary for Windows 10 and 11?
Yes, antivirus is necessary for Windows 10 and 11 to provide comprehensive protection against evolving cyberthreats. While Windows Security offers basic security features, it may not be sufficient against advanced malware, phishing attempts and ransomware. A reliable third-party antivirus, such as Panda Dome, adds layers of defense, including real-time scanning, identity protection and secure browsing.
Which Is the Best Antivirus for Windows 10 and 11?
The best antivirus for Windows 10 and 11 depends on your specific needs, but top options like Panda Security, TotalAV and Norton stand out for their advanced protection. Panda offers malware defense, ransomware protection, identity theft protection and a secure VPN.
How Do I Know If I Have a Virus on Windows 10 or Windows 11?
Signs that your Windows 10 or 11 system may have a virus include:
- Unusually slow performance
- Frequent crashes
- Unexpected pop-ups
- Unfamiliar programs running in the background
- Excessive internet usage
- Browser redirects to suspicious websites
Running a full system scan using built-in tools like Windows Security or third-party antivirus software like Panda Security can help identify and remove potential threats.
Panda Security specializes in the development of endpoint security products and is part of the WatchGuard portfolio of IT security solutions. Initially focused on the development of antivirus software, the company has since expanded its line of business to advanced cyber-security services with technology for preventing cyber-crime.


Panda Free Antivitus

FREE TECHNICAL SUPPORT
