


Component monitors are, basically, scripts that run regularly on your devices - and if a specific condition is met, it will raise an alert. For example, in the ComStore are pre-configured component monitors for a number of anti-virus packages that will alert if your definitions are out of date, or if the anti-virus software is not running.
But as extensive as those ComStore monitors are (and there are, at the time of writing, over 40 of them covering anti-virus, backups, CPU temperatures, predicted hard drive failures and many other options), sometimes you need or want to be able to generate alerts based on your own specific requirements. For example, you might want to:
- Monitor a backup or anti-virus package that we don't currently have a ComStore component for.
- Check to see if a specific file or folder exists.
- Run some diagnostic command (like dcdiag, or repadmin) and check the output for issues or failures.
- Interrogate a database using a command line tool (like osql) and check specific values.
For cases like these (and many others), Systems Management includes a powerful scripting and alerting capability that allows you to write your own monitoring scripts - we call these Custom Component Monitors, and this document will guide you through the initial stages of understanding how they work, and how you can start to write them.
Pre-requisites
This article is going to cover a number of scripting concepts, so you will need to be familiar with things like batch scripting, or vbscript.
First Step - Running Locally on Your Machine
Before we get under the bonnet with how Systems Management runs monitors, and generates alerts based on their output, we need to be confident that the script we are going to run does what we actually expect. The easiest way to do this is to write it just to run on a single device first, and then we'll add more complexity later as we try to capture output, and define input variables.
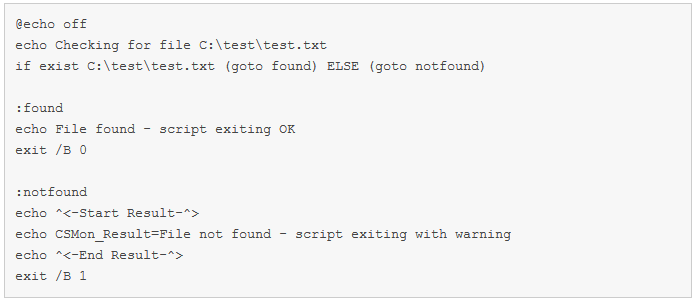
To give a working example, we're going to look at one of the scenarios mentioned above - monitoring for the existence of a specific file. So we're going to write a batch script that looks for C:\Test\test.txt. If that file exists, the script will output as such and terminate with exit code 0 (which means, basically, "success"). If it doesn't, we'll see some output telling us, and it will terminate with exit code 1 (which means "failure").
Our script to do that looks like this:
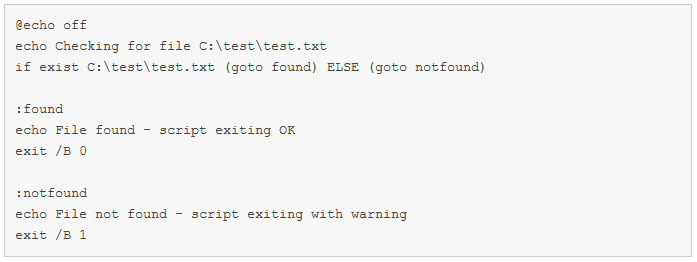
Save that as a batch file (.bat), remembering to make sure your text editor of choice doesn't inadvertently add a .txt extension. Running it should give you some output like this (assuming there isn't a file called test.txt in the relevant folder):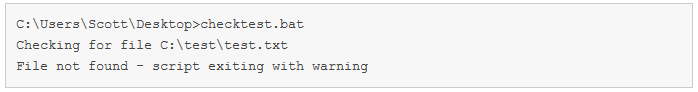
Then create the file c:\test\test.txt and run again, to confirm that it also works when the file is there:
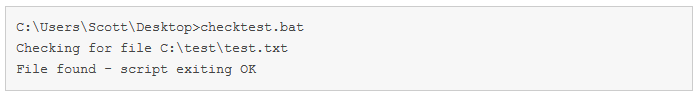
And now we have our working script, checking for the existence of a file called test.txt in C:\test.
Getting the output into the right format
When Systems Management is configured to run a custom component monitor, what its really doing is running your scripts regularly (on the schedule you will set when the monitor is created - more on that later) and then looking for some text output that looks like this:
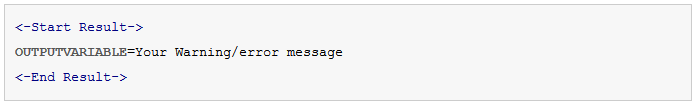
where "outputvariable" is a variable you configure within the monitor setup.
What that really means, in terms of creating your script, is that the output needs to be more than just a line of text saying what the error is - it now needs to generate output that looks like that above. To do that, we just need to modify our initial script to have a more Systems Management specific output section:
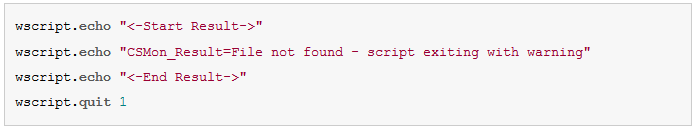
You'll notice that in this case, the and characters have to be "escaped" so they are parsed correctly in a batch file (otherwise they're treated as though they were piping data into or out of a command). Other monitor script types don't need to do this - for example, the vbs equivalent would be:
Now our script is checking the right things, and is outputting in the correct format, too. So we're ready to take this script and get it into Systems Management and deployed out to some devices.
Turning our script into a Systems Management Monitor Component
To create an Systems Management Monitor component using the script you have written, follow these steps:
- Log onto the Systems Management Web Portal as an Account Admin (or a user who has the relevant permissions to be able to create components).
- Click on the Components tab. That will take you to a screen showing all the components contained in your account.
- Click the Add Component button at the top left.
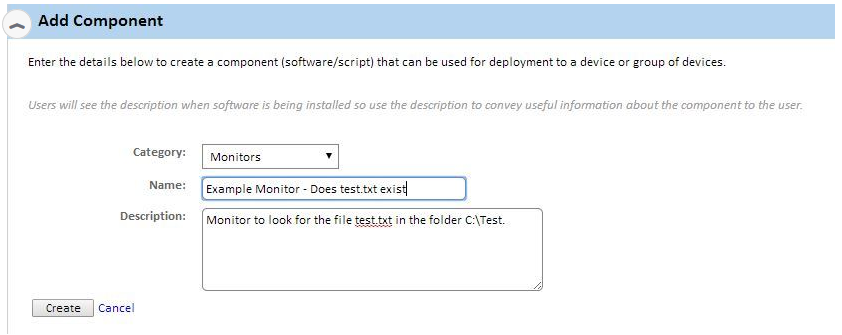
- In the window that then appears, set the Category dropdown to Monitor, and give your component a relevant name and description. Then click the Create button.
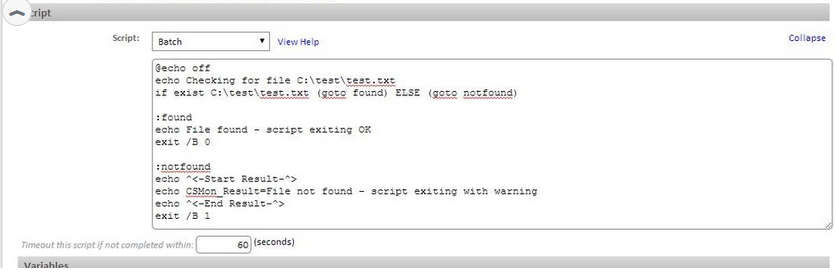
- Scroll down to the Script section of the window that appears - this is where we're going to put the actual body of the script that our monitor is going to run.
- In the Script dropdown menu, select Batch (since our example script here is a batch/command shell script). If you're using a different script, choose the relevant script type here from the options available.
- Type (or copy/paste) your working and tested script into the main window of this script section.
- Next, we need to let Systems Management know what variable name we're using to capture the output in - in the case of this script, we used CSMon_Result, so we need to configure that as a Output Data. To do this, click the green "+" alongside the Output Data section, and in the window that appears, specify the output variable name as CSMon_Result, and the type as String, then click Add.
- Click Save, and your monitor component will be saved, and added to your accounts component list, ready for deployment!
Creating a monitoring policy to use your component
Monitors are applied to your devices using policies, and those policies can be targeted at your devices in a number of different ways - filters, groups, profiles (or some combination of those). For the sake of simplicity, here we are going to target every device in our AEM account to be monitored for the existence of test.txt in C:\Test.
To create a monitoring policy, using the "test.txt" custom monitor, and applying it to all devices in your account:
- Click on the Account tab in the Web Portal, then the "Policies" sub-tab (second from the right)
- Click the New Account Policy button
- In the window that appears, give your new policy a relevant name, and select Monitoring from the Type dropdown menu (you can leave the Based On dropdown set to New Policy). Click Next.
- Click the Add a target button
- The Target Type dropdown lets you choose whether you want to apply this policy to a filter (a dynamic list of devices based on some criteria), a group of devices, or a group of profiles. For the sake of this example, we want to apply our offline monitor to everything - we can do that using a filter, so choose Custom Device Filter
- Clicking into the Custom Device Filter box to choose a filter will present you with a list of all the filters you can choose from - including both the default filters that are in every account, and any custom filters you've created yourself. In this case, we'll choose All devices - the list is in alphabetical order, so it should be near the top. Click Add.
- Now, click the Add a monitor button.
- In the Monitor Type dropdown, choose Component Monitor. Click Next.
- Your custom monitor component will be listed in the first dropdown on the Monitor Details screen - select it from that dropdown. This is also where you configure how often this monitor should run - enter an appropriate schedule. For now, we can leave the alert and auto-resolution details to the default values. Click Next.
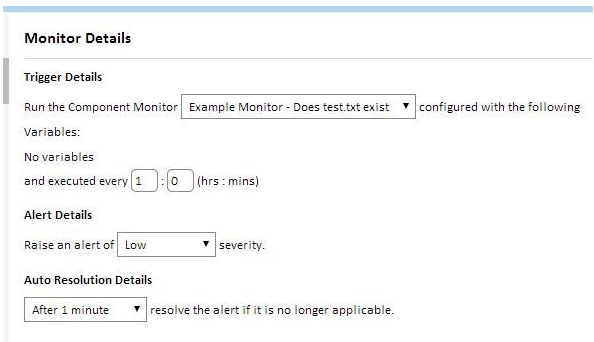
If you would like to receive email alerts when this monitor is triggered, tick the Email the following recipients box and enter your email address in the appropriate box (remember to click Save once you've entered it).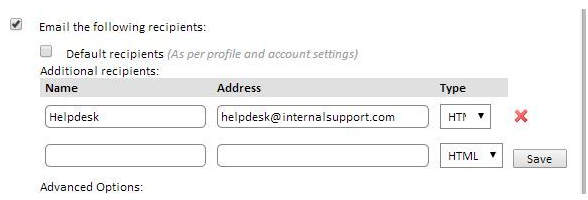
Then click next until you reach the end of the Add a monitor screens. - Now, click Save to finish creating your policy.
- You'll now be back at that list of policies in your account, with your newly created policy in the list. Now all you need to do to send that policy out to the targeted devices is click Push changes...
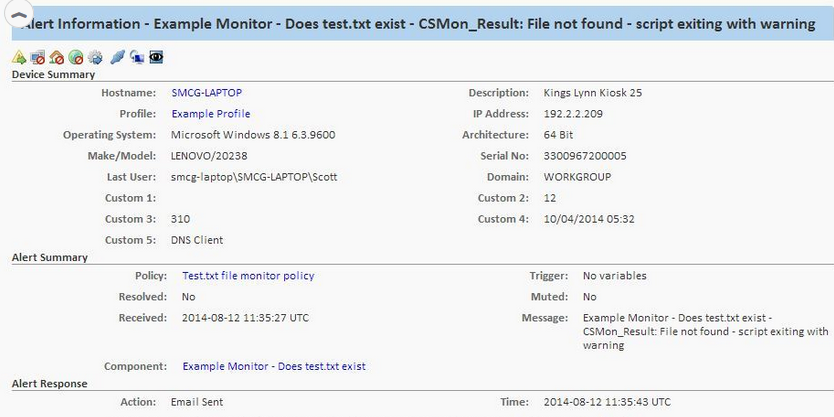
How do I see the output?
If you added your email address as an alert recipient, you should have received 1 email per device that looks like this:
And you can see all of the raised alerts by clicking on the Account tab in the Web Portal, then going to the Monitor tab.